SPSS and Excel are two common programs people use to work with data. This blog post will compare the two programs side-by-side.
SPSS stands for Statistical Package for the Social Sciences. Excel is a spreadsheet program made by Microsoft. Both allow you to analyze and make sense of numbers and information.
We’ll look at what each program is good at and not so good at. We’ll also discuss who should use SPSS vs Excel and who should use it based on their needs.
Whether you are a student, have a job analyzing data, or just need to understand some numbers better, this introduction to SPSS and Excel will help you decide which one to use. Getting the right tool for the job makes working with data much easier.
What is SPSS: A Simple Explanation
Table of Contents
SPSS (Statistical Packages for Social Science) in terms of statistical packaging tools, it is the leader of the market. There are various SPSS uses that are considered as the data manipulation and storage derivative. There are two batch processing methods: first one is interactive batches and the second one is noninteractive batches.
It was created by SPSS Inc., but it was eventually purchased by IBM in 2009. SPSS was previously known as “under the umbrella.” SPSS was renamed by IBM SPSS in 2015 after being acquired by IBM.
Also, an SPSS open-source version is available which is known as PSPP. With very few exceptions, the statistical process and the formation of techniques of data manipulation are used in this process. By using these statistics and the formulation the large data chunks are professionally manipulated. The SPSS open-source version is a good one, and it won’t expire in future.
Anybody can use the software of SPSS for lifetime. For analytical features, SPSS is the best one to provide the graphics of high-quality.
The best part of this software is when you create standard graphics in this software. Then you can output the graphics as HTML5 files. It means that you can access these files through your browser too. This means you can use your browser to access these files as well.
Pros of SPSS
SPSS (Statistical Package for the Social Sciences) is a widely used software for statistical analysis in various fields. Some of its pros include:
- Powerful statistical analysis capabilities for complex research designs and large datasets.
- A wide range of tests, from regression to factor analysis, are built right in.
- Designed specifically for data analysis, it is more efficient than general spreadsheet programs.
- Automates many routine data management and analysis tasks to save time.
Cons of SPSS
While SPSS is a popular and powerful tool for statistical analysis, it also has some limitations and drawbacks:
- Expensive software that requires purchasing a license, especially for organizations.
- Steep learning curve compared to more user-friendly programs like Excel.
- Limited flexibility for customizing visualizations and reports beyond standard output.
- Data size limitations for the base version may require upgraded editions.
Also Read: A Complete Guide On The Uses of SPSS
What is Excel: A Simple Explanation
Excel is user-friendly statistical and one of the most powerful software. It enables you to store data in a tabular format, that is, in rows and columns. In a variety of ways, you can also interact with your data .
By using some of the potent formulas you can sort and filter the data. Excel’s pivot tables are its best feature. By manipulating the data you can create new insights and for this you can use pivot tables.
Excel has a number of features which helps you with statistics. And also for importing and exporting of the data, there are multiple ways for it. You can also integrate the data into the workflow.
Like no other statistics software, By using its programming abilities, excel allows you to create the custom function.
Excel’s main function is to create data records and change them according to the needs of the users. As mentioned previously, Excel allows you to analyse, create reports, and so on using an external database.
And nowadays, Excel offers the best graphical user interface as well as the ability to use graphics tools and visualisation techniques.
Pros of Excel
Microsoft Excel is a widely used spreadsheet software with numerous advantages, including:
- Very user-friendly interface that most people are already familiar with.
- Excellent for data visualization with robust charting and graphing capabilities.
- Allows combining data analysis with word processing, presentations, and other tasks.
- Lower cost compared to dedicated statistical software like SPSS.
Cons of Excel
Despite its widespread use and numerous advantages, Microsoft Excel also has some limitations and drawbacks:
- Limited statistical capabilities compared to dedicated analysis software like SPSS.
- Potential for errors when working with large, complex datasets.
- It can be cumbersome to perform repetitive tasks across multiple sheets/workbooks.
- Relatively basic visualizations that may require additional software for advanced graphics.
SPSS vs EXCEL: The Key Differences
The following are lists of points that explain the key differences of SPSS vs EXCEL:
- SPSS provides us with clear information or insight about the computing storage’s utilization and the memory system’s efficiency. Excel shows how to extract the information as well as knowledge from data in a variety of formats.
- SPSS shows us how to build processes in batches and work, as well as how to manage memory in programming. Excel provides a view of how data can be used for studying on how data will be stored, processed, and manipulated in order to avoid redundancy and for future use make data relevant.
- SPSS is a tool which is used for computing that includes subjects like Data Storages and Data Formats, whereas Excel includes mathematics concepts like Statistics, Algebra, Calculus, and Advanced Statistics, etc.
- Computations, probabilistic theories, reasoning, discrete structures, and databases are all included in the SPSS sub-areas. Excel has a lot more mathematical operations and analytics that are more simple.
- SPSS is all about using the techniques of manipulation of data efficiently to fetch the good results and Excel is all about correctly processing and storing data.
- SPSS is a tool which is batch processing with stats, whereas Excel is a data computing and technique of formulation.
- SPSS is the major batch processing & statistical tool whereas Excel is a standard application of data manipulation.
- SPSS is evolving with concepts that are advanced one’s, and IBM is developing more efficient and advanced algorithms. Excel is becoming more complex to operate and maintain on a daily basis, but it still needs improvements.
- By focusing on manipulation of data SPSS deals with the statistical algorithms. Excel is a combination of data storage and mathematics in a variety of forms.
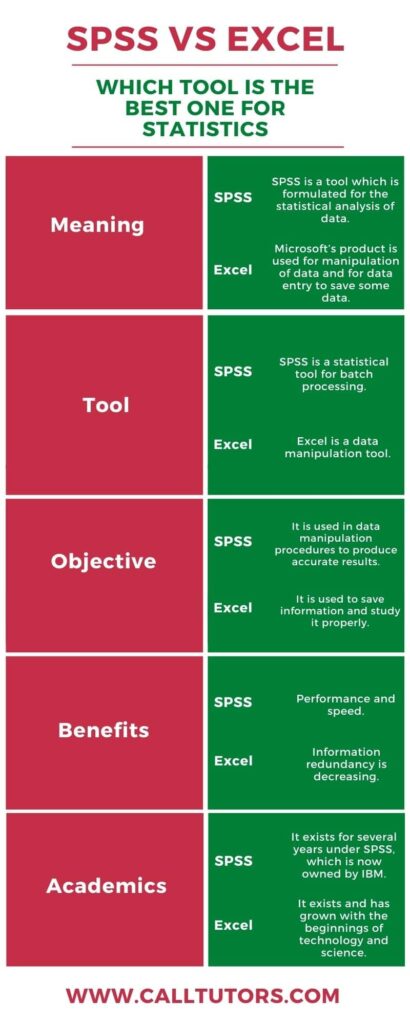
Head-to-Head Differences Between SPSS vs Excel
| Terms for comparison | SPSS | EXCEL |
| Definition or Meaning | SPSS is a tool which is formulated for the statistical analysis of data. | Microsoft’s product is used for manipulation of data and for data entry to save some data. |
| Tool | SPSS is a statistical tool for batch processing. | Excel is a data manipulation tool. |
| Objective | It is used in data manipulation procedures to produce accurate results. | It is used to save information and study it properly. |
| Benefits | Performance and speed. | Information redundancy is decreasing. |
| Usages | It is used for statistical computations and data usage in accordance with IBM standards. | It is used to manage and store data using Microsoft defined methods. |
| Real-time usages | It is used to develop ultra-fast and advanced technologies such as supercomputers and other advanced devices. | It maintains and manages the vast amount of clients data. |
| Field | It involves the full technological field, which is defined as a superset of Data Science. | It is a subset of network ability in which information knowledge is gained via the use of various technologies and methodologies. |
| Applications | It applies to all professional activities and large-scale businesses. | It applies to the businesses where sensitive large-scale data must be processed. |
| Industry | After obtaining a degree in this profession, you can work as a data analyst or scientist. | After obtaining a degree in this profession, you can work as a data analyst or scientist. |
| Academics | It exists for several years under SPSS, which is now owned by IBM. | It exists and has grown with the beginnings of technology and science. |
SPSS vs Excel: Which Performs Better?
SPSS and Excel are good at different things when it comes to performance.
SPSS is built just for working with data and statistics. It can handle extremely large data sets with millions of rows of numbers. SPSS calculates complex statistics super fast and efficiently.
Excel can start to slow down with really big data over 1 million rows. It’s not made for that level of intense number crunching.
However, Excel is much better for everyday basic data tasks. It lets you quickly sort, add up, organize, and visualize numbers with nice charts and graphs.
The reports and visuals from SPSS are plain and rigid. You’d need other programs to make them look modern and pretty.
So, in simple terms, SPSS performs way better for heavy-duty statistical work on massive amounts of data. Excel outperforms for quick everyday data management and visualization on normal spreadsheet sizes.
The performance winner depends on if you need a high-powered statistical brain or a fast, flexible basic data tool.
SPSS vs Excel: Which One’s More Popular?

Google search data shows that more people search for Excel than for SPSS.
Over the last 5 years, searches for “Excel” have been around 60-70 times higher globally than searches for “SPSS”.
Excel gets a ton of searches in most countries and regions around the world. SPSS does get more searches in a few places like Malaysia, Saudi Arabia and Pakistan, likely because it’s used more in research and education there.
Overall, Google data scores in Excel at around 88 out of 100 for search popularity, while SPSS only scores around 12 out of 100 on average.
This matches up with how Excel is part of Microsoft Office and is found on most computers. Lots of people and businesses of all types use it. SPSS is only used for more specialized statistical work and costs more, so not as many people search for it.
The Google search numbers clearly show Excel is way more popular and searched for by regular users compared to the more niche SPSS software.
Bottom Line (SPSS vs Excel)
In the battle of SPSS vs Excel, there is no clear overall winner. The best choice depends on your specific data analysis needs.
For intensive statistical modeling, complex research projects, and working with enormous data sets, SPSS is the superior performance powerhouse. Its dedicated statistical capabilities exceed what Excel can handle.
However, Excel reigns supreme for general data wrangling, basic analysis tasks, and quick visualization needs. Its familiar interface and integration with other Microsoft apps make it an everyday productivity enhancer.
SPSS requires more investment in cost and training but provides advanced analytics. Excel is inexpensive and user-friendly but with limitations for heavy statistical lifting.
Whether you choose the high-powered SPSS or the versatile Excel comes down to the size, complexity, and primary purpose of your data work. The right tool makes all the difference.
FAQs
Is SPSS better than Microsoft Excel?
Yes, SPSS is better when it comes to data analysis because it is specifically created for statistics. SPSS and Microsoft Excel have a similar look and feel, with menus, spreadsheets, and built-in statistical functions. But when we compared SPSS to Microsoft Excel, SPSS has:
1. Basic functions, such as descriptive statistics, are easier and faster to reach with pull-down menus.
2. There are many different charts and graphs to pick from.
3. Statistical tests can be accessed more quickly.
Is SPSS difficult to use?
The fundamentals of SPSS are generally simple to understand, but knowledge and awareness to subtle details are required to write efficient and elegant syntax.