Most of the students are stuck with the Frequency distribution table. They want to know how to make a Frequency distribution table. The frequency distribution table is the most important part of the statistics. It is a great method for summarizing statistical data. It displays to us how frequently some of our statistical data values.
The different values of the statistical data distributed over a given interval in a list within a given time, table or graphical representation. The frequency distribution table refers to the data in tabular format with two columns comparing the particular data and its frequency.
It is difficult to make the frequency distribution table for each statistical data f you don’t have analyzed data, for instance, each previous year’s test match score or student’s scores. But, if you have properly analyzed data by researchers, you can create it easily.
Let’s follow the below-given information to know about to be a little more detailed guide about it and tips on how to make a Frequency distribution table.
What Is Frequency Distribution Table?
Table of Contents
A frequency distribution table refers to a chart showing the frequency of any particular outcome in any data set. To make it easy to read and understand, it’s a great way to organize data. Many tables have three columns displaying the possible results, then count points for each test, and the number of each outcome, while some tables only have two columns and do not show the tally marks.
This table helps the researchers assess the relative abundance within the knowledge of each goal statistic. The full availability helps to show how much of the potential objective data we can include within the data set. The relative abundance is often present in the form of the histogram of the frequency.

What Is Frequency?
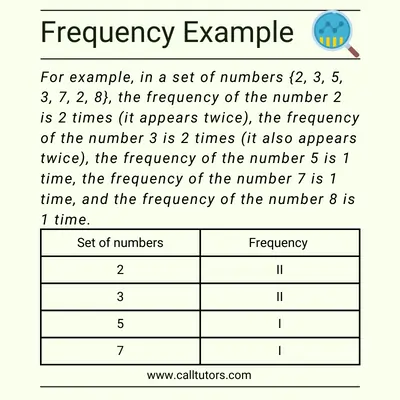
In general, frequency refers to the number of occurrences of a particular event within a given time period. Also, the number of times a particular value or item appears in a dataset or population is called a frequency.
How to make a frequency distribution table
these are the following steps for how to make a frequency distribution table.
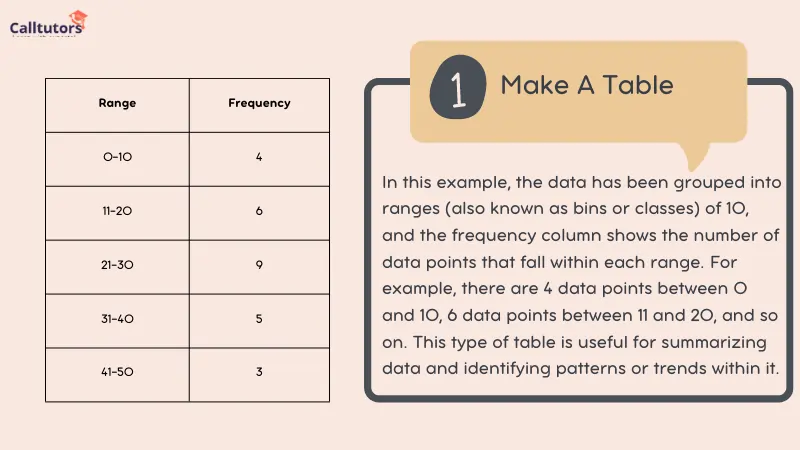
Step 1:- Make a Table
Drawing three columns on even a bit of paper is the first possible option to do when attempting to make a frequency distribution table. So scan through your set of data and show all possible results in the data in the section on the left. Use the middle column to render counting marks on each event in the results.
On having a counting mark for each bit of data, then count tallies and start writing the corresponding number in the third column. Finally, make sure that each column is labelled. The first column will also be marked with a title representing the types of outcomes represented by the data. The 2nd column is marked’ tally marks’ as well as the 3rd column is labelled’ frequency.
Here’s an example table for frequency distribution:
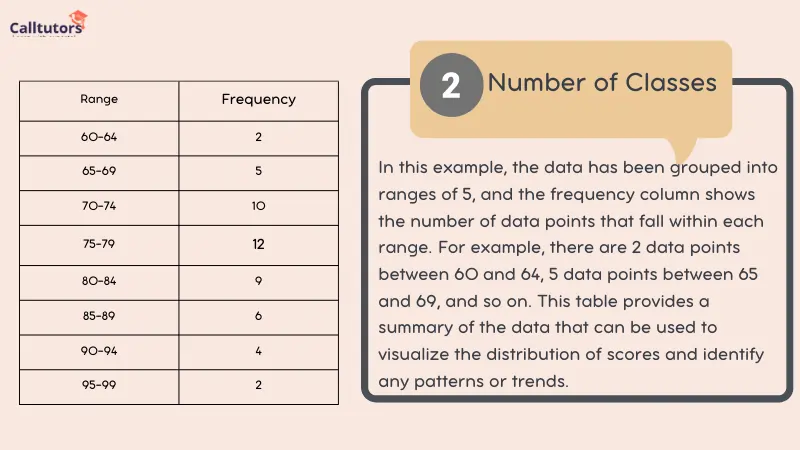
Step 2:- Number of Classes
The percentage of classes depends heavily on the width of statistical data. The number of classes is somewhere between 5 and 20. When you introduce many types, the primary purpose of the dissemination of data will also be ruined through sound knowledge. On either side, that use of few classes would not be enough to provide the full information. Thus, there is little need to maintain the right balance.
Here’s an example table for frequency distribution using 8 classes for the data set of 50 test scores:
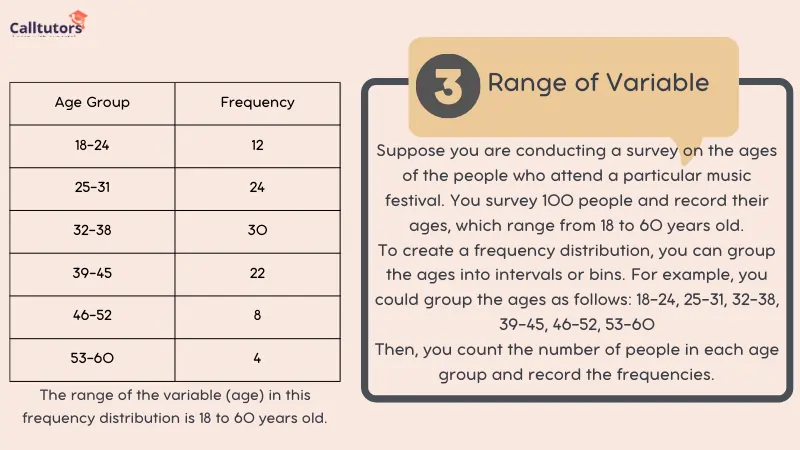
Step 3:- Range of Variable
To choose the right number of classes, it is necessary to find out the scope of the variable information by considering the change between the maximum and the minimum values of the statistical data.
here is an example of a range of variables in a frequency distribution:
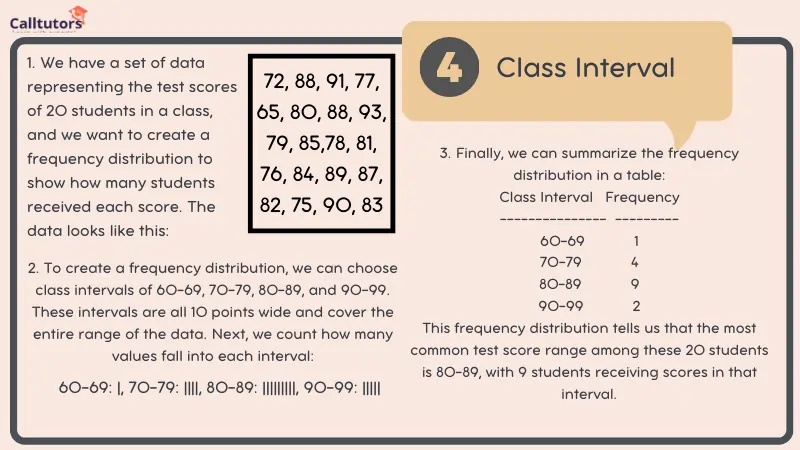
Step 4:- Class Interval
You need to split the spectrum by the number of courses to calculate the average distance or class intervals. It will also provide us with equal class intervals. If equivalent class intervals are considered troublesome, then imbalanced sizes must be used. You may find what to calculate class intervals online.
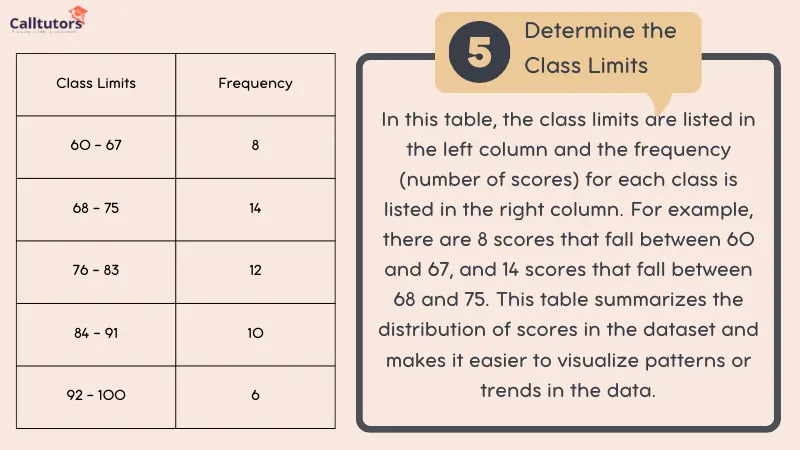
Step 5:- Determine the Class Limits
Typically the lowest class starts with the lowest number of data or any number less than. If the class boundary is a multiple of degree intervals. Then it is considered the best. By applying the value of class interval to a limit of the lowest class, you may calculate the limit of the high class. When you consistently use the class interval, you will be able to locate out the class limit left out.
Here’s an example of a frequency distribution table based on the class limits we calculated in the previous example:
Quick Links
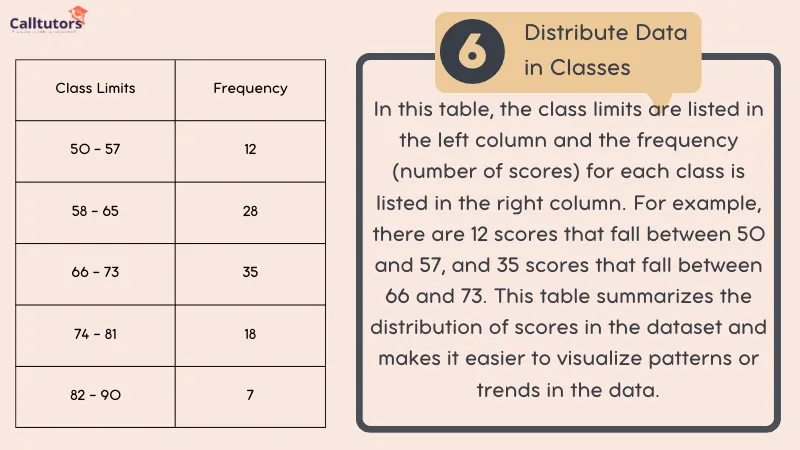
Step 6:- Distribute Data in Classes
Tally-column is the easiest way to distribute statistical information to relevant groups. In which all variables are expressed in a tabular manner. The number of tallies then enters in the column of frequencies of the Frequency Distribution Table.
Here’s the frequency distribution table based on the example we just went through:
What Is The Importance of Frequency Distribution Table?
These are the following importance of the frequency distribution table.
- Data summarization: Frequency distribution tables help summarize large data sets concisely and informally. y.
- Easy comparison: It makes it easy to compare data from different sources, such as periods, regions, or populations.
- Data analysis: Frequency distribution tables are often used as a first step in data analysis. They help to identify the range of values, the most common values, and the distribution of values in a dataset.
- Decision-making: It provides valuable information for decision-making. It can help managers and executives make informed decisions about resource allocation, product development, marketing strategies, and other business-related decisions.
Wrap up
It is primarily used to create the data or values obtained in the increasing order depending on frequencies and the magnitude. The use of a frequency distribution table mainly depends on how to coordinate various data values easily. In the full analysis of data values, this table can play an important role. Get the best among the best help with statistics and statistics assignment help from the experts. We are offering a great deal in statistics assignment help services to the students.
Frequently Asked Questions
What are the two types of frequency tables?
The frequency distribution tables are of two types: Ungrouped or discrete frequency distribution tables and Grouped or continuous frequency distribution tables.
What is frequency distribution easy?
Frequency distributions are visual displays that organize and present frequency counts so that the information can be interpreted more easily.
What should be included in a frequency distribution?
A frequency distribution is a representation, either in a graphical or tabular format, that shows the number of observations within a given interval.